
Pricing: $395/year per campus.
Please contact your DMAC Education Service Center rep for a quote here.
lead4ward and DMAC Solutions© are excited to bring you a web-based application to organize and analyze your data. lead4ward’s specially designed data visualizations and reports help your school use STAAR and local data to identify strengths and challenges, determine priority focus areas, and plan better classroom instruction.
The lead4ward application in DMAC allows users to generate reports to populate the data tools showcased during the lead4ward trainings statewide. The look and feel of the application mirrors that of the State Assessment and TEKScore features of DMAC. The lead4ward application includes:
STAAR Quintile Performance and Growth Report – this report functions like the Quintile Report listed below, but is specifically designed for STAAR assessment data. Annual Growth data is displayed for applicable grade levels/subjects and interactive features allow for shading of STAAR performance categories (Approaches, Meets, etc.) and growth levels for each student. The tool also includes filtering options for highlighting student demographic groups.
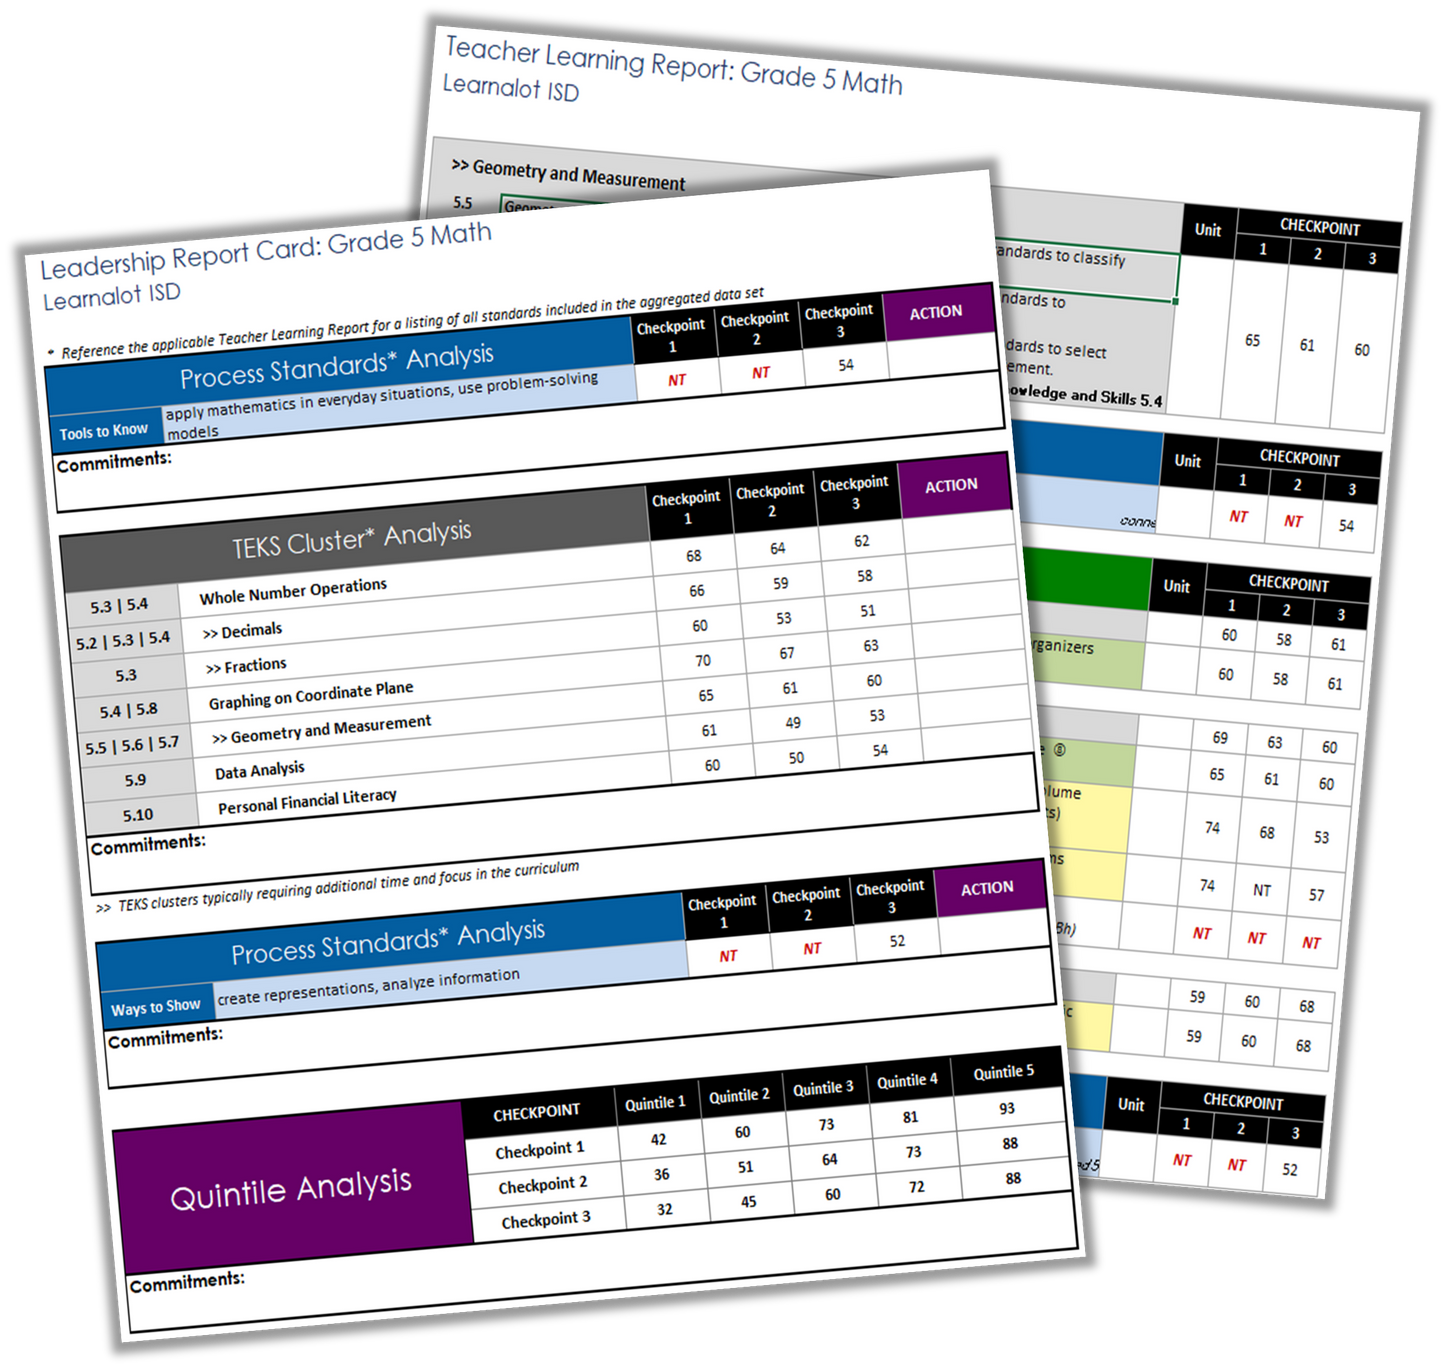
Quintile Analysis Report – this tool uses individual or aggregate assessment data and distributes students into five equal groups, or quintiles, with an average % correct displayed for each quintile. Quintile Reports help identify performance gaps and which students may be in need of intervention and may be used with local or STAAR assessments.
Leadership Report Card – this 1-page report provides summary-level data from lead4ward TEKS Clusters, or unique bundles of standards for each content area and grade/course. The Leadership Report Card helps identify areas of focus in the curriculum for teacher professional development and/or student intervention.
Teacher Learning Report – this report provides data for each TEKS Cluster with aligned Student Expectations and/or subclusters. Teacher Learning Reports (previously known as Student Learning Reports) help identify specific parts of the curriculum where students (and/or teachers) may need support and enhance data analysis for instructional planning.
Standards Report – this report displays performance at the Student Expectation level – organized by standard type (Readiness, Supporting, Process, and non-tested). The Standards Report helps identify growth, maintenance, or decline at the Student Expectation level (previously known as the Heat Map).
Source Data Report – provides a custom frequency distribution showing the number of items on all selected assessments by Checkpoint for TEKS Clusters and Student Expectations.
Subcluster Intervention Report – This report displays students (by name) into two categories – Got it! and Not yet – organized by subclusters from Teacher Learning Reports. It serves as a guide for providing targeted intervention by looking at specific parts of the curriculum where students may need support.
Threshold Analysis – This report will display summary results for the percentage of scores at and above 7 possible cut points, or thresholds. There is also a feature in Aware that allows threshold analysis reports to be generated at the student level.
Coming Soon! IQ Data Report – populates STAAR response (answer choice) data for a campus or district. Items on the report are organized in the same order as items on the lead4ward Released Test (IQ) resource and provide a great way to analyze student mistakes or error patterns.
Please call the DMAC Help Desk at 1.866.988.6777 with any questions.